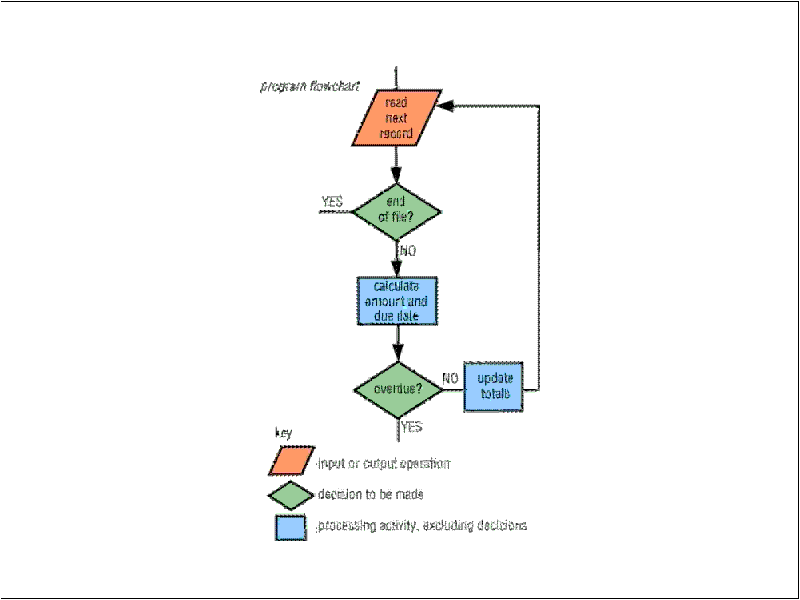
Flow chart diagram, often used in computing, to show the possible paths that data can take through a system or program. A system flow chart, or data flow chart, is used to describe the flow of data through a complete data-processing system. Different graphic symbols represent the clerical operations involved and the different input, storage, and output equipment required. Although the flow chart may indicate the specific programs used, no details are given of how the programs process the data. A program flow chart is used to describe the flow of data through a particular computer program, showing the exact sequence of operations performed by that program in order to process the data. Different graphic symbols are used to represent data input and output, decisions, branches, and subroutines.

Chapin chart or block diagram (structogram)
Advantages: easier to draw and does not allow the jump (goto). Every block diagram is the combination of the three basic Chapin chart elements: 1. sequential, 2. loop, 3. branch (conditional) blocks.
The sequential is the simplest, which means the simple order of steps (or other blocks). Example: b and c, the length of two sizes of a rectangle are given. Questions are the area and perimeter of the rectangle. The solution:
input b,c
A:=b*c; P:=2*(b+c)
output A, P
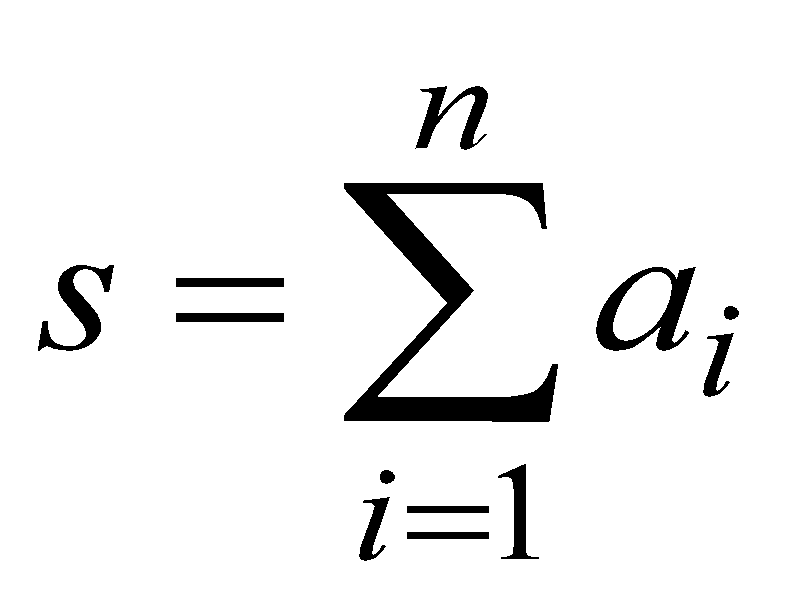
program loop is a part of a computer program that is repeated several times. The loop may be repeated a fixed number of times (counter-controlled loop) or until a certain condition is satisfied (condition-controlled loop). For example, a counter-controlled loop might be used to repeat an input routine until exactly ten numbers have been input; a condition-controlled loop might be used to repeat an input routine until the data terminator "XXX" is entered.An other possible way of categorization is the position of the control: it may in the beginning of the loop or at the end. (The second type of loop is executed one times anyway.)
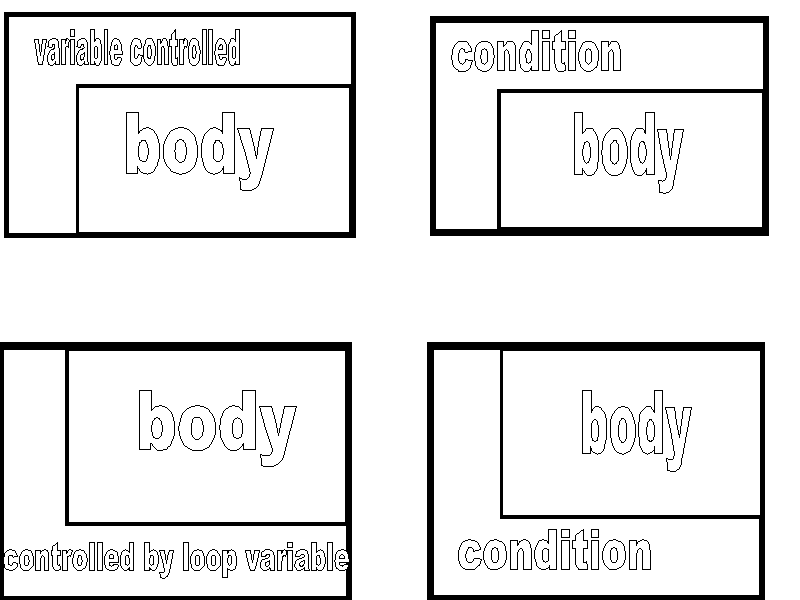
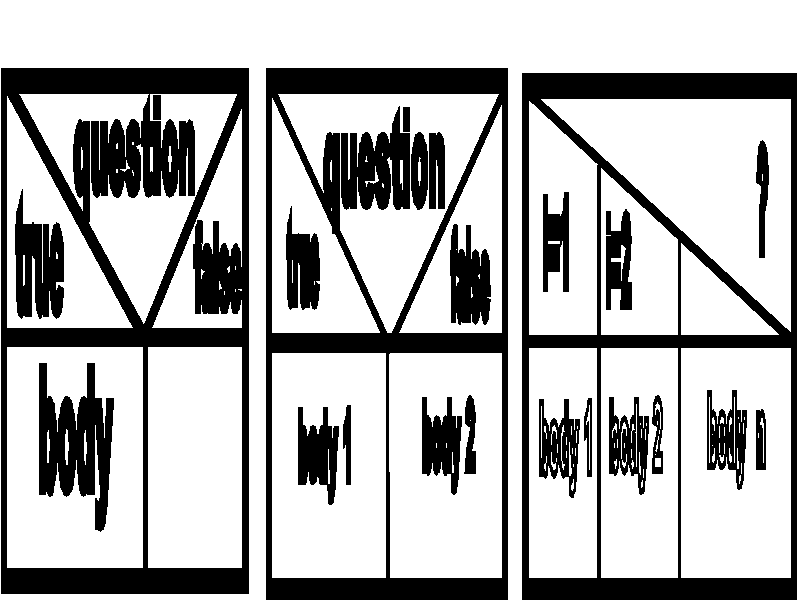
branch is used when two or more answers are possible and the belong to condition(s). Three chart types exists:
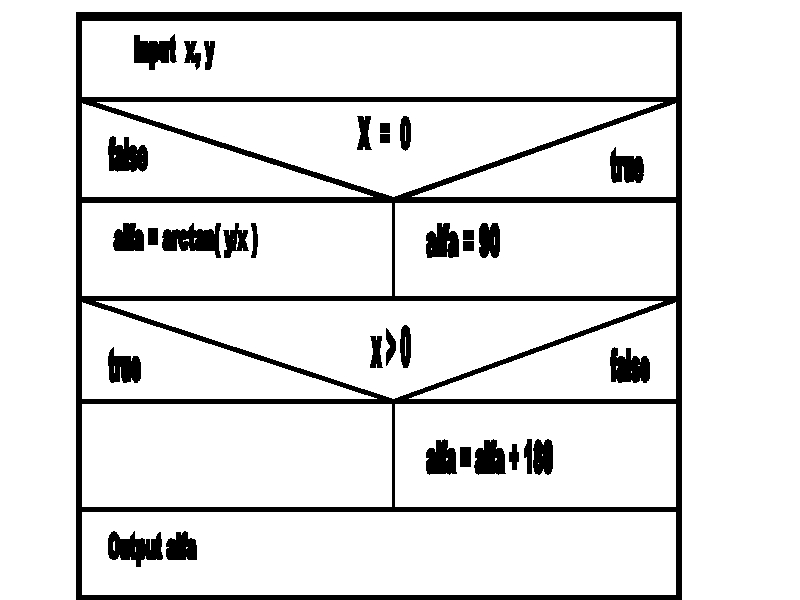
Example 3. X and Y are the co-ordinates of a point in the plane. Find the angle between the origin and the given point. The angle may be between 0 and 360 degree. The algorithm: alfa=if X not equal 0 then arctan(Y/X) else 90. If X<0 then alfa=alfa+180. The Chapin chart:
